Hi, I'm Divyanshu Negi
|
Leveraging Python, SQL, and Power BI to turn data into decisions

Scroll Down
|
Leveraging Python, SQL, and Power BI to turn data into decisions
Get to know more about who I am and what I do
I’m Divyanshu Negi, a passionate data analyst eager to turn raw data into meaningful insights.
My journey began with curiosity — I’ve always been drawn to finding patterns, solving problems, and understanding the “why” behind numbers. This curiosity led me to explore tools like Excel, SQL, Python, and Power BI, where I learned to clean, analyze, and visualize data effectively.
Through personal and academic projects, I’ve developed a strong foundation in data storytelling, dashboard creation, and data-driven decision-making. I enjoy transforming messy datasets into clear visual insights that make sense to everyone.
I may be at the start of my professional journey, but my passion for data and continuous learning keeps me moving forward — turning information into impact, one dataset at a time.
Technologies and tools I work with as a Data Analyst
My work in data analysis and sales performance optimization
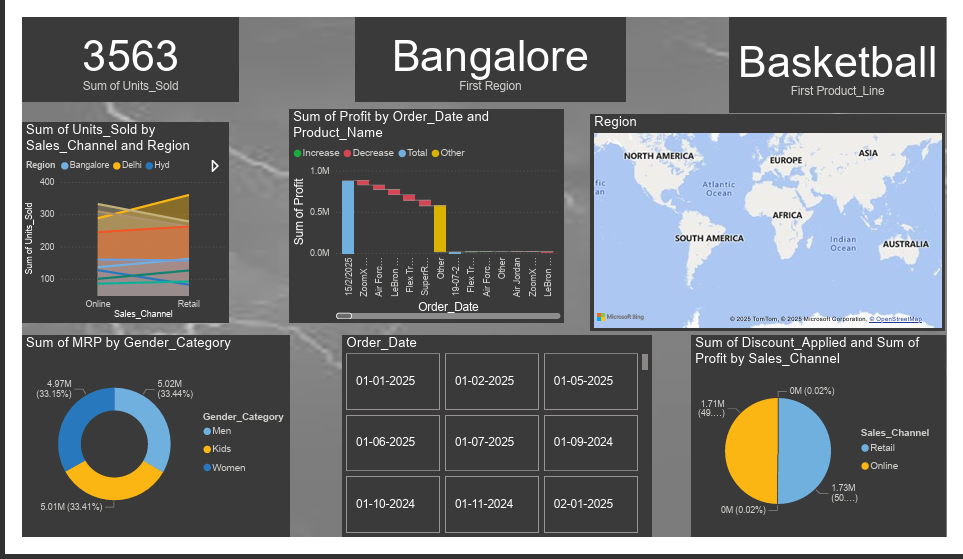
A comprehensive Power BI dashboard analyzing Nike sales data. The dashboard breaks down performance by gender, sales channel, region, and product line. Key visualizations include profit trends, units sold, and the impact of discounts on overall sales. It provides actionable insights for business decision-makers.
This project visualizes the sales trends across multiple regions. Using Power BI, we can see how Nike's sales evolve over time in different areas like Bangalore, Delhi, and Hyderabad. This analysis helps to identify key regions for targeted marketing and sales strategies.
This project analyzes how discounts applied across different sales channels (retail vs. online) affect overall profit. The insights help optimize discount strategies to maximize profit margins, especially during peak sales periods like seasonal promotions.
Let's work together on your next project
divyanshun598@gmail.com
+91 9910779061
New Delhi, India